A reliable resource assessment and characterization are essential preliminary steps for the effective implementation of renewable energy applications. The optimal choice is to obtain data from weather stations with extensive records of continuous readings spanning multiple years. Consequently, the standard procedure involves establishing a station at the project site immediately upon selection for construction, gathering local relative and meteorological data, and employing this information for the validation or adjustment of modeled data, among other purposes.
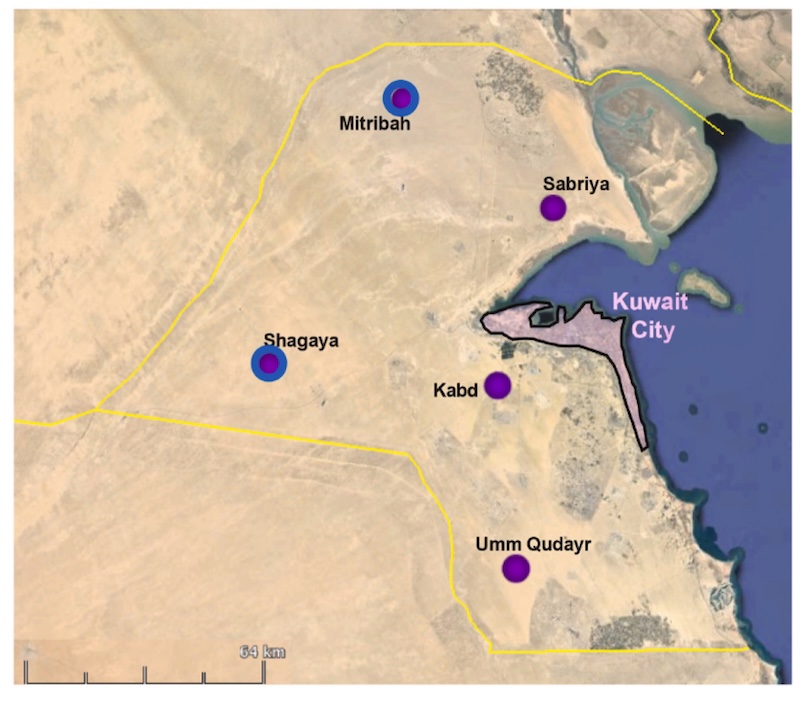
In 2012, KISR conducted a comprehensive assessment of renewable energy resources, utilizing both terrestrial observations and extensive satellite-based modeling. Five weather stations were established in Kuwait and evenly placed as illustrated in the Fig 1 with the coordinates presented in Table 1.
The aim of the KISR measurement campaign is to acquire accurate solar wind, and meteorological data as part of a long-term initiative to diminish uncertainty in solar and wind resources across various locations.
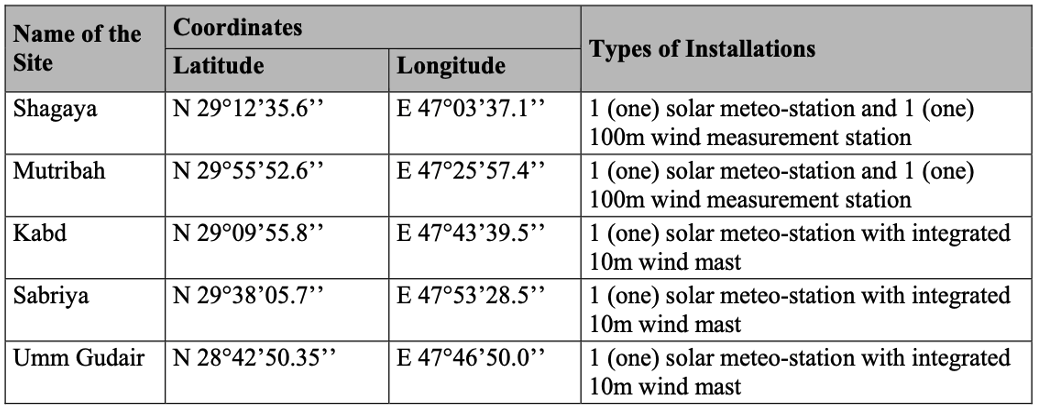
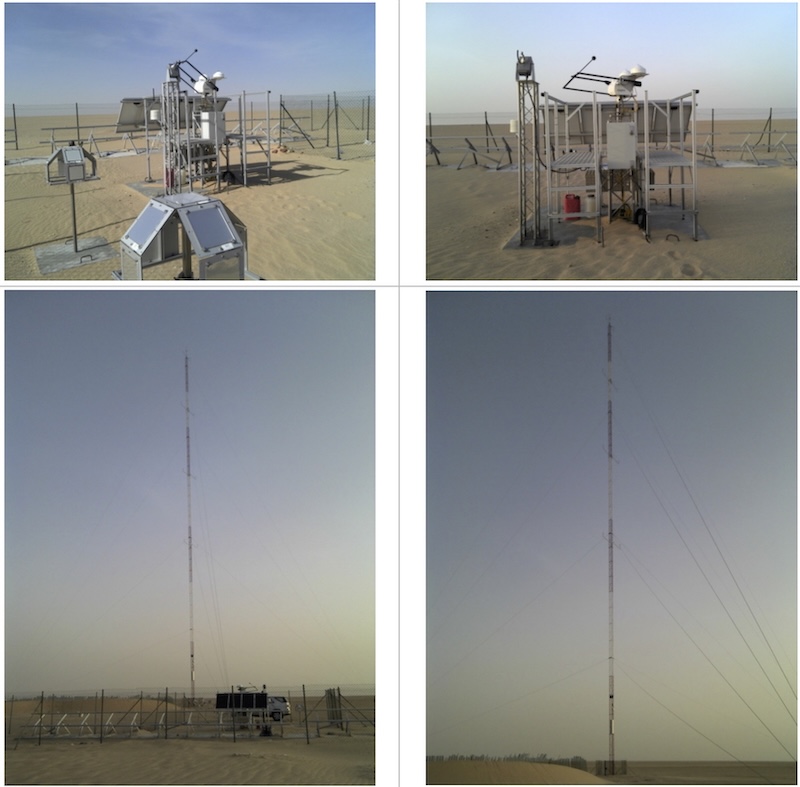
Fig 2 displays photos of the weather station at the Shagaya sites. All five sites feature the capacity to measure Global Horizontal Irradiance (GHI), Direct Normal Irradiance (DNI), Diffuse Horizontal Irradiance (DIF), temperature, relative humidity, atmospheric pressure, and wind speed (WS). The Shagaya and Mutribah location is also equipped with a 100 m wind tower that measures wind speed at 40, 60, 80, 97.8, and 100 m, as well as wind direction.
The aim of the KISR measurement campaign is to acquire accurate solar wind, and meteorological data as part of a long-term initiative to diminish uncertainty in solar and wind resources across various locations.
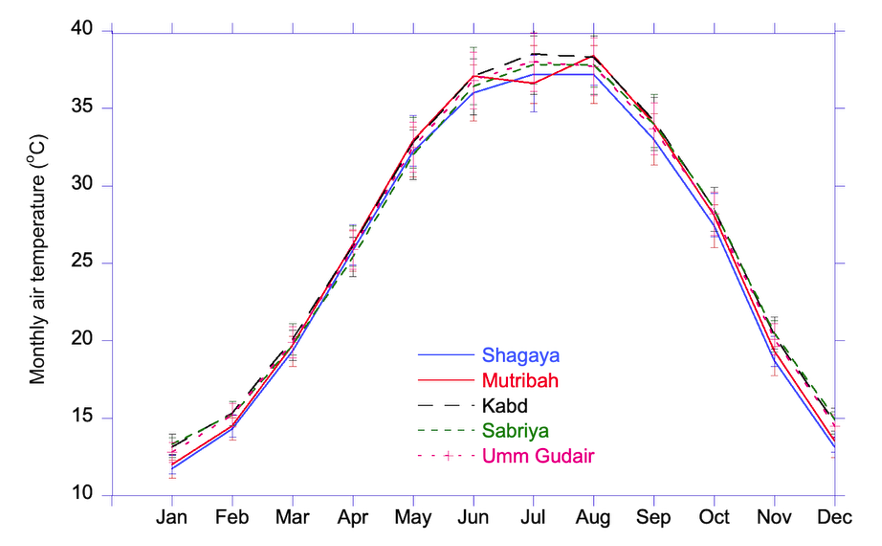
All the sites are characterized as simple by plain topography classifications. They have a typical desert climate characterized by hot and dry summers and short winters (November to February) when the temperature drops below 10 oC. The annual mean air density is about 1.131 kg/m3 and is lowest in the summer due to very hot and dry air. In the summer, strong Shamal winds and massive dust storms can last for days. A short rainy season exists during winter. In addition to persistent, strong Shamal winds, there is a consistent diurnal pattern. Fig 3 shows monthly daily average characteristics of temperature at all sites, they represent diurnal statistics calculated over 24-hour daily cycle. Minimum and maximum air temperature are both calculated as average of minimum and maximum values of temperature during each day (assuming full diurnal cycle - 24 hours) of the given month.
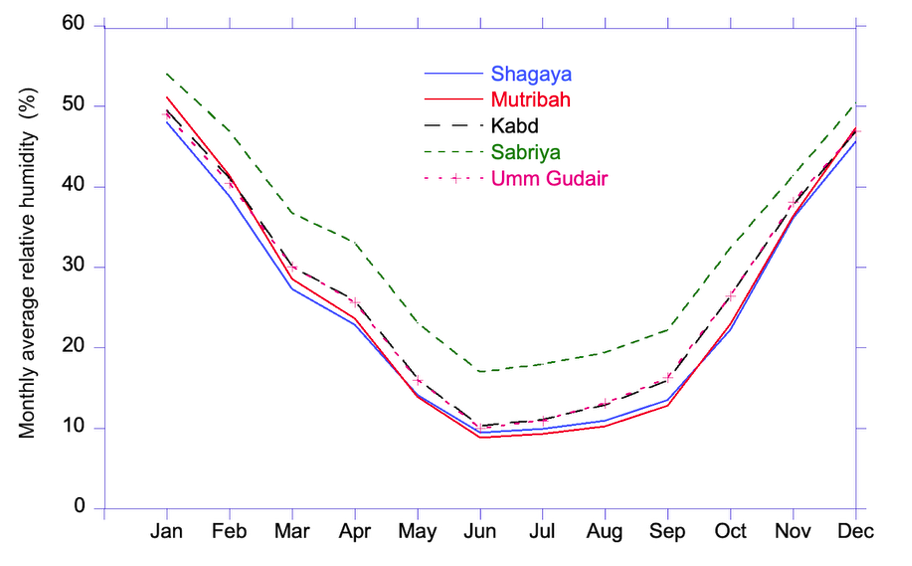
The relative humidity in Fig 4, shows the expected opposite behavior to temperature.
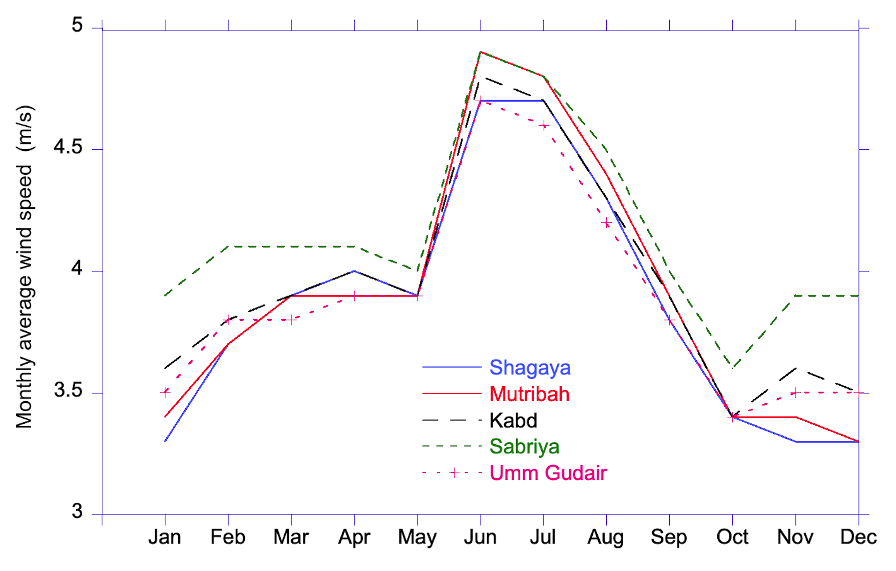
A wind assessment period of only 12 months was insufficient to determine the typical wind characteristics over the long term. Hence, a 3Tier Inc. wind data provider conducted a record extension assessment based on mesoscale numerical weather prediction (NWP) modeling. A Measure-Correlate-Predict (MCP) method was applied by correlating the model predictions and the actual observations to determine the long-term wind conditions with low uncertainty. The procedure analyzes the relationship between the measured and modeled long-term reference data. Fig 5 shows the monthly average wind speed for all sites during the first year of campaign (2012-2013). Clearly, the wind speed is highest during summer, and lowest in the winter. This is due to the strong North western hot (Shamal) wind during the summer.
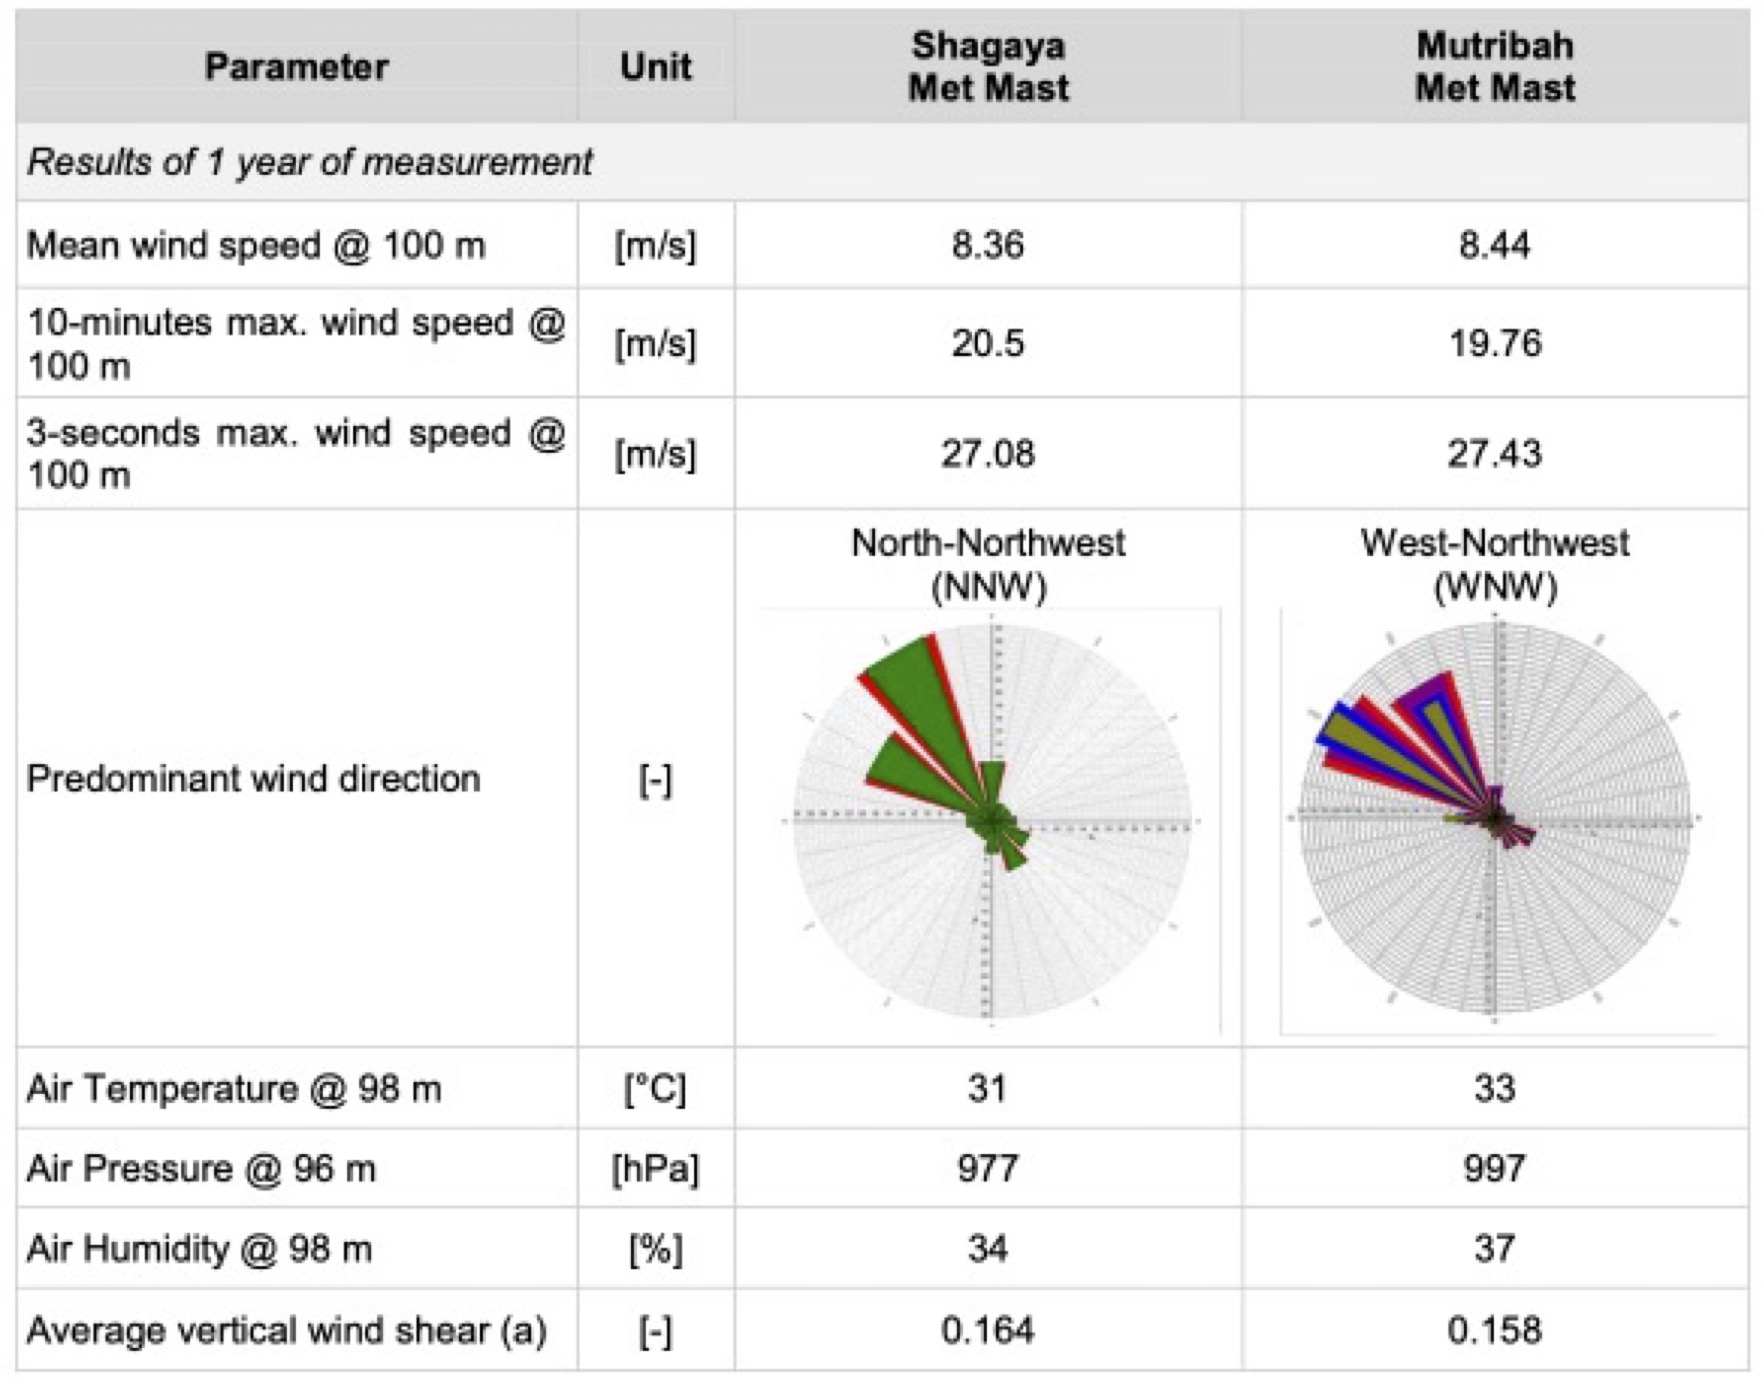
The expected long-term wind conditions are shown in the Table 3 below. Therefore, the site's specific wind characteristics have been assessed according to the IEC 61400-1 (edition 3) standard. According to IEC 61400-1 standard, a wind energy site is associated with different "Wind Turbine Generator System classes" based on site-specific wind data like the expected mean wind speed at hub height, the turbulence intensity, and extreme wind speeds. Table 4, provides the IEC site classification considering extreme and average wind speeds and the ambient turbulence intensity for both sites.
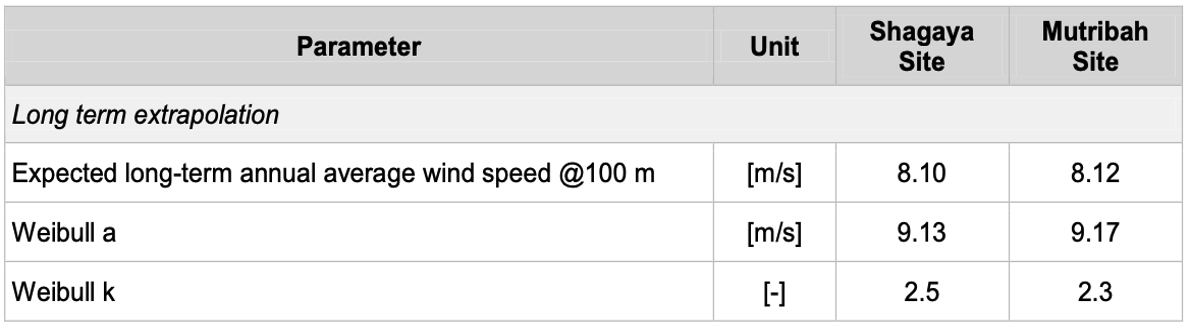
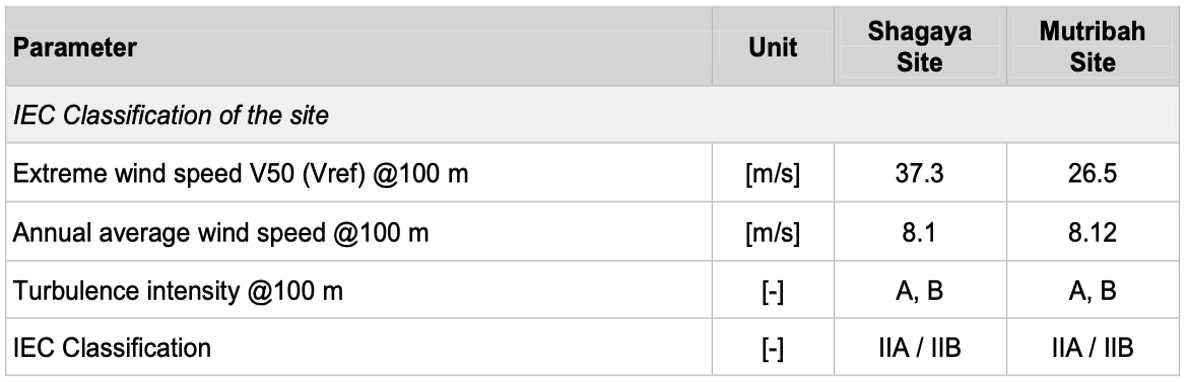
The wind study concludes that the expected long-term average annual wind speed at the met mast amounts to 8.10 m/s and 8.12 m/s at 100m for Shagaya and Mutiribah, respectively. Considering the parameters of average annual wind speed, extreme wind speed, and characteristic ambient turbulence intensity, the site at the position of the met mast at 100 m meets the requirements of IEC Class IIA and IIB. An uncertainty analysis was carried out. Five sources of uncertainties associated with the estimated parameters were identified, resulting in a combined uncertainty of 7.2% for both sites.
The objective of the measurement campaign is to acquire high accuracy solar and meteo data for reducing uncertainty of long-term site assessment and also of solar maps. Solar resource was measured by the following instruments:
The solar irradiance and meteorological data are provided in 10-minute and hourly time step, in further processing calibration the 10-minute data were used. The cleaning procedure was followed on daily basis for the pyrheliometer stations to weekly basis for the RSP stations. The measurements of the GHI for the first year (2012-2013), is shown in Fig 6 as monthly average for all the sites. When comparing the sites, they have very similar pattern in terms of GHI values. Differences between particular sites can be expressed by relative standard deviation, which compares monthly and yearly values. Variability in yearly averages of GHI is only 1.9%. Monthly averages have differences ranging from 1.4% in September to 3.2% in January. Small variability of values is caused by very similar site characteristics and this indicates that all sites will show similar PV performance characteristics.
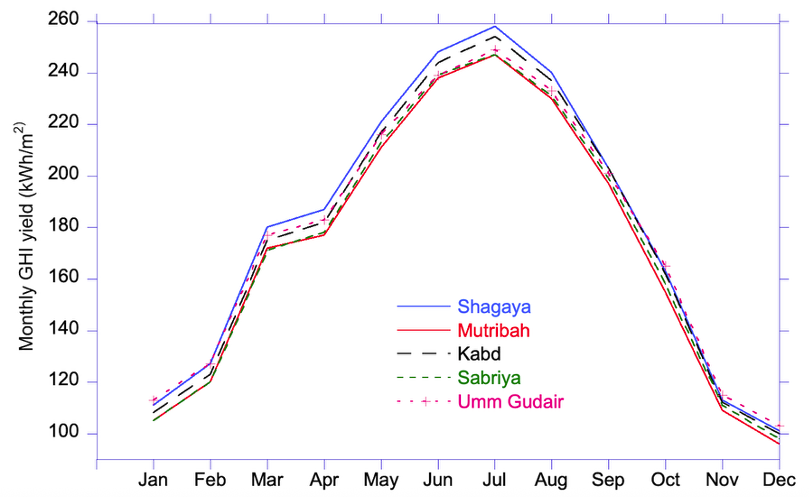
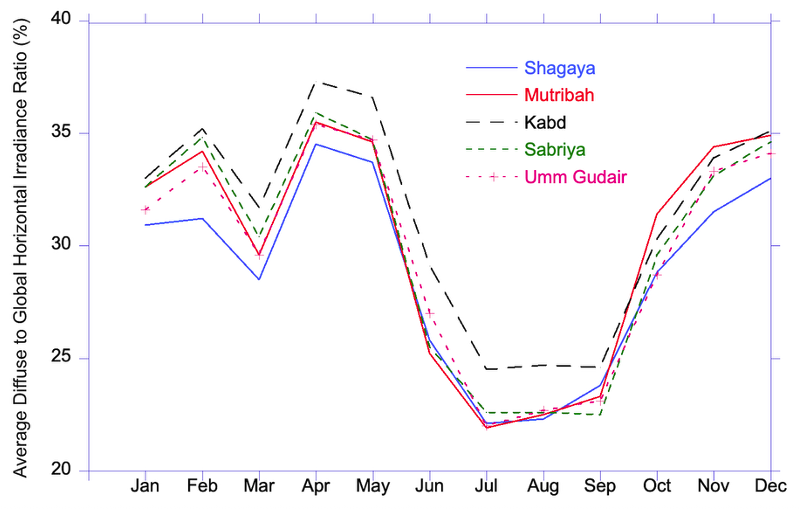
Fig 7, show ratio of the averages of Diffuse component (DIF) to Global Horizontal Irradiation (GHI) for each site and month. All sites have very similar DIF/GHI ratio, except Kabd with slightly higher values in spring and summer season. The best conditions with clear sky and low aerosols typically occur during summer season from June to September. Other months have higher occurrence of clouds, aerosols and water vapor, which reduces PV electricity production. During months with increased diffuse fraction (increases load of atmosphere by aerosols and water vapor) higher demand for maintenance is to be expected. Lower yields can be expected also in case of solar concentrators during period with higher ratio of diffuse irradiation.
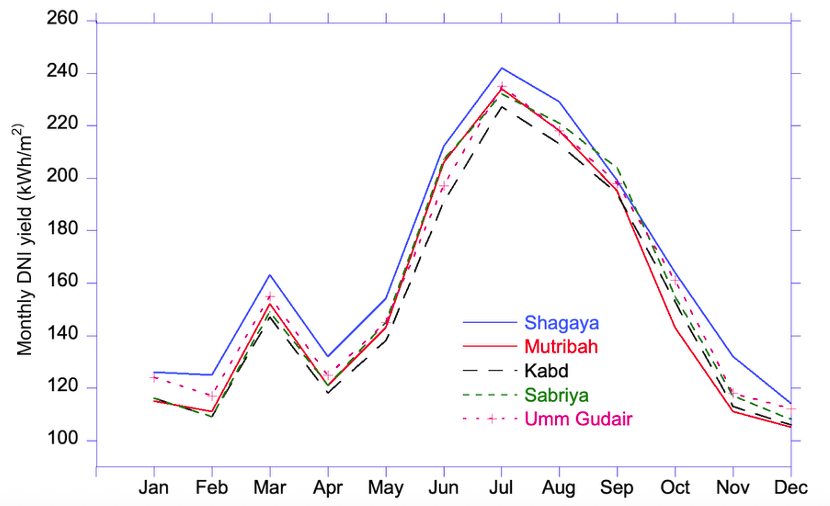
Comparison of monthly values for Direct Normal Irradiation (DNI) is shown on Fig 8. All sites have very similar pattern in terms of DNI values. Differences (variability) between the sites can be expressed by a relative standard deviation, which compares monthly and yearly values. Positional variability of DNI yearly averages between sites is 3.2%. Monthly averages have differences ranging from 1.9% in September to 6.1% in February. Relative standard deviation of DNI values, for individual sites, is slightly higher than variability of GHI values, which is given by higher sensitivity of direct irradiation to aerosol and cloud attenuation. As it is shown in Fig 6 (similar to GHI pattern), the best season with highest values of DNI is from June to September.
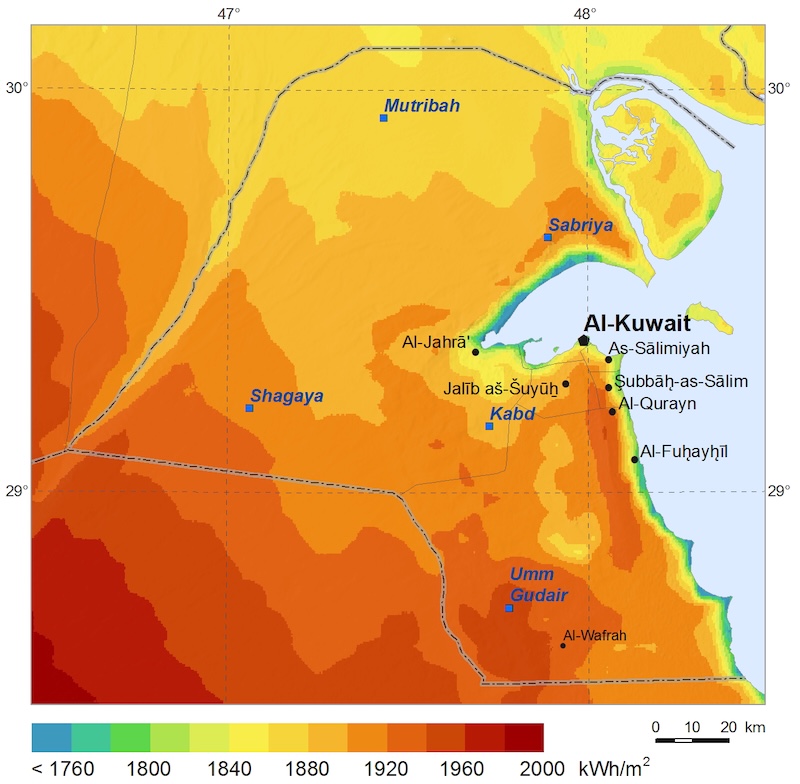
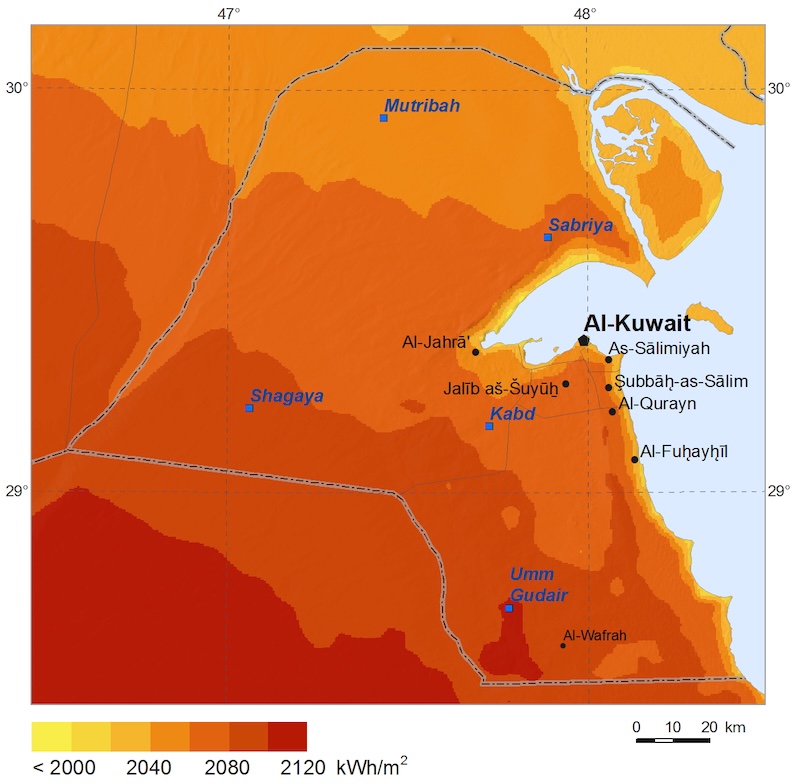
Finally, Fig 9 and 10 show, solar country maps for the DNI and GHI respectively, resulted from the Site-adaptation of the satellite-based solar time series with ground measurements allowing reduced systematic deviations present in the SolarGIS time series at all sites.